Gdb
GDB oneliners
Recently I wanted to print disassembled main funciton of the program to the file
so I can read it in my Emacs, but it turned out I can’t simply redirect the GDB output
to the file with disassemble main > main.asm command in gdb command line.
But there is -ex option exists in gdb command so we can execute some gdb commands
right after gdb is initialized.
Looks like this:
GDB PEDA config
Hey everyone.
I already have a post about GDB Dashboard package which is cool but I’ve just found somethine even better.
Meet PEDA. It looks really awesome. I wasn’t able to try all the commands it provides but the interface looks pretty awesome.
It shows stask in realtime which Dashboard package lack. Not just showing addresses but also strings if any of them are on the address.
Now my GDB looks like debuggers I have used to before like OllyDbg.
GDB print string from memory
Hey, just found a command for gdb that prints a string from memory address.
Looks like this x /s <addr>. Very useful if you need to print out the string that is in memory somewhere.
Previously I’ve used other flags to print for example hex values but was pretty hard to read. Glad there is special solution in GDB for this.
GDB dashboard
If you use GDB you definitely have to try Dashboard package by Andrea Cardaci.
Here is how it looks like:
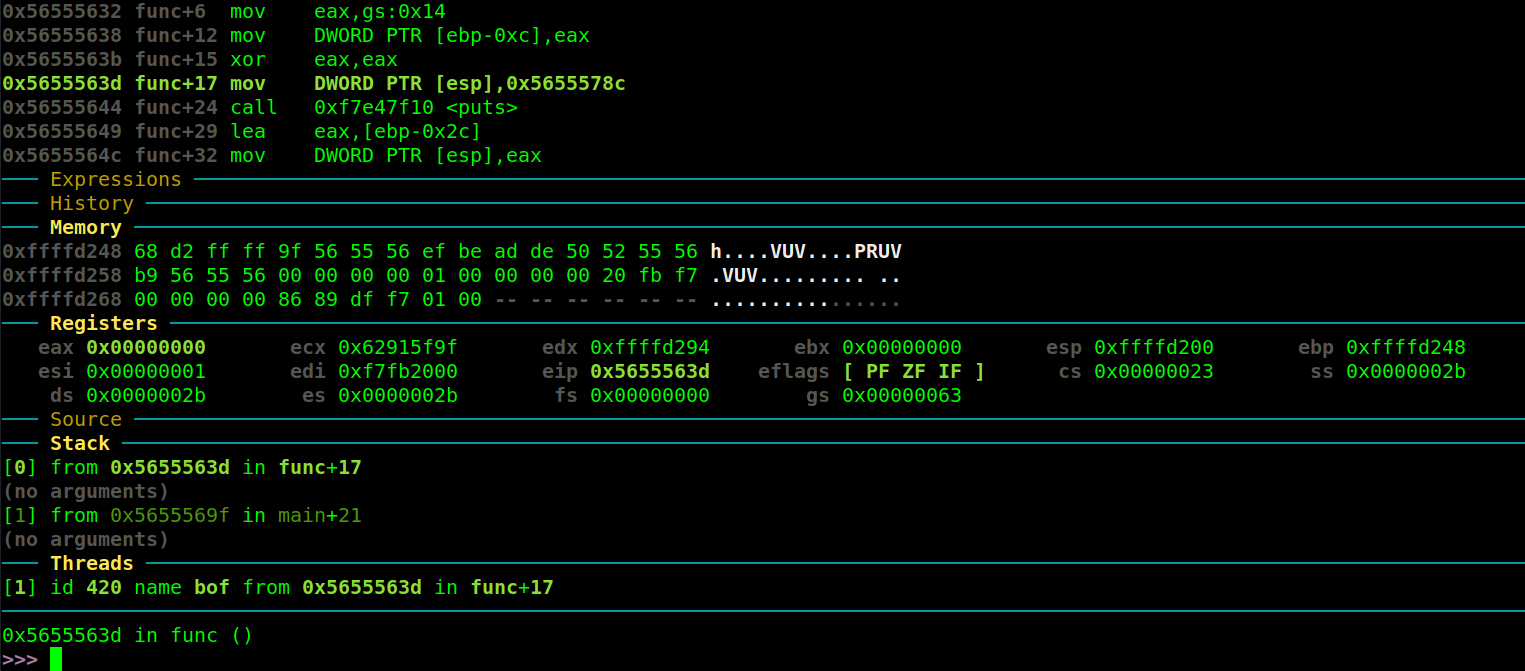
Looks very nice, it updates itself each time when you step or do another action.
It was confusing why Memory area is empty by default and shows nothing even when I try to x <memory>.
It turned out I have to tell dashboard to watch for particular area of memory. Here is how to do it: